| disease | Diabetes |
| alias | Diabetes Mellitus |
Diabetes mellitus is a common group of metabolic endocrine disorders, divided into primary and secondary types. The former constitutes the vast majority, with a genetic predisposition. Its fundamental pathophysiological basis is metabolic disturbances caused by absolute or relative insulin deficiency and increased glucagon activity, including abnormalities in carbohydrate, protein, fat, water, and electrolyte metabolism, often leading to acid-base imbalance in severe cases. It is characterized by hyperglycemia, glycosuria, impaired glucose tolerance, and abnormal insulin release tests. Clinically, it is asymptomatic in the early stages, with symptoms such as polyphagia, polydipsia, polyuria, thirst, hunger, weight loss or obesity, and fatigue appearing during the symptomatic phase. Long-term sufferers often develop complications involving the cardiovascular system, brain, kidneys, eyes, and nerves. Severe cases or stress can lead to life-threatening conditions such as ketoacidosis, hyperosmolar coma, and lactic acidosis, and are prone to complications like pyogenic infections, urinary tract infections, and pulmonary or subcutaneous nodules.
bubble_chart Epidemiology
The first national diabetes survey in China, conducted from 1978 to 1979 among 100,000 people in Shanghai, found a prevalence rate of 10.12%. From 1980 to 1981, a survey of 300,000 people across 14 provinces and cities nationwide revealed a prevalence rate of 6.09% (standardized prevalence rate of 6.74%). At that time, there were approximately 7 million diabetic patients in China. The disease is more common in middle-aged and elderly individuals, with prevalence increasing with age, significantly rising after 45 years old and peaking at 60 years old. The prevalence rates vary greatly across different regions in China, with Ningxia having the highest rate (10.94%), followed by Beijing, and Guizhou the lowest (1.51%). In terms of occupation, the prevalence is higher among cadres, intellectuals, retired workers, and housewives, and lowest among farmers. Mental workers have a higher prevalence than physical workers, and urban residents have a higher prevalence than rural residents. The prevalence rate among overweight individuals (BMI ≥ 24) is three times that of those with normal weight. Among ethnic groups, the Hui people have the highest prevalence, followed by the Han, with minority groups having a similar prevalence to the Han. The vast majority of diabetes cases in China are type II (NIDDM). In a survey of 100,000 people in Shanghai, only one person under 20 years old was found (0.09%). The exact prevalence rate of IDDM, according to research by the Children's Hospital of Shanghai Medical University from 1980-1991 and 1989-1993, was 0.61 and 0.83 per 10,000, respectively.
From 1994 to 1995, another survey was conducted among approximately 250,000 people nationwide (over 25 years old), finding that diabetes and IGT each accounted for 2.5%. The number of cases had more than tripled compared to 15 years earlier, primarily due to improved living standards, modernized lifestyles, reduced physical activity, and nutritional excess.According to the cause of the disease, it can be divided into two major categories: primary and secondary. The primary type accounts for the vast majority, and the cause of the disease and the mechanism of disease are unclear. The secondary type is in the minority, such as pituitary diabetes in acromegaly, steroid diabetes in Cushing's syndrome, etc.
(1) Diabetes The characteristics of each type are as follows:
1. Insulin-dependent diabetes mellitus (IDDM, Type I) Its characteristics are: ① onset is relatively acute; ② typical cases are seen in children and adolescents, but it can occur at any age; ③ plasma insulin and C-peptide levels are low, and secretion remains flat after glucose stimulation; ④ insulin therapy is essential, and sudden cessation can lead to ketoacidosis, which is life-threatening; ⑤ heredity is an important factor, manifested by changes in the positivity rate of certain HLA antigens on the 6th chromosome; ⑥ islet cell antibodies (ICA) are often positive, especially within the first 2-3 years of onset. Sometimes, the positive reaction may appear several years before the onset. Recent studies have shown that in the identification of Type I patients, the positive reaction of glutamic acid decarboxylase antibodies (anti-GAD) is more significant than ICA, especially in patients with a longer and slower course of the disease.
2. Non-insulin-dependent diabetes mellitus (NIDDM, Type II) Its characteristics are: ① onset is relatively slow; ② typical cases are seen in adults and the elderly, occasionally in young children; ③ plasma insulin levels are only relatively low, and there is a delayed release after glucose stimulation, sometimes the fasting plasma insulin level in obese individuals may be higher, and insulin after glucose stimulation is also higher than in normal individuals, but lower than in non-diabetic obese individuals of the same weight; ④ genetic factors are also important, but HLA is negative; ⑤ ICA is negative; ⑥ insulin effect is often very poor; ⑦ oral anti-diabetic drugs alone can generally control blood sugar. According to weight, it can be divided into non-obese and obese types. In non-obese NIDDM, it actually includes some Type I patients with very slow autoimmune progression, whose initial stage clinical manifestations are very similar to NIDDM and are treated as NIDDM, but eventually fully exhibit the characteristics of Type I, requiring insulin to avoid ketoacidosis. Therefore, at the time of diagnosis, the age is often older, and the positive result of anti-GAD is significantly higher than NIDDM, 76%:12%. It can be called Latent Autoimmune Diabetes in Adults (LADA), some also call it Type 1.5 diabetes. Recent domestic and foreign reports of mitochondrial gene mutation diabetes, due to its clinical characteristics being atypical NIDDM: early onset, no obesity, often requiring insulin therapy during the course of the disease and progressive decline in pancreatic β-cell function, accompanied by neural deafness, so it is likely to belong to one type of LADA. The understanding of mitochondrial diabetes is currently deepening. In NIDDM, there is also a type that occurs before the age of 25, can control high blood sugar without insulin within 5 years, and generally does not develop ketoacidosis, called Maturity-Onset Diabetes of the Young (MODY), mostly autosomal dominant inheritance, its microvascular complications are as common as in general NIDDM, but macrovascular complications are less.3. Diabetes related to malnutrition Its characteristics are: ① this type is mostly seen in developing countries in Asia, Africa, and South America, in tropical or subtropical regions, so it is also called tropical pancreatic diabetes, with various names, later named by WHO as diabetes related to malnutrition; ② onset age is mostly adolescents (15-30 years old); ③ thin body, malnutrition; ④ many cases require insulin therapy, sometimes the dose is large; ⑤ but ketoacidosis is rare; ⑥ this type can be further divided into the following two subtypes:
⑴ Pancreatic Fibrosis with Calculi Type: ① Pathologically characterized by chronic pancreatic fibrosis, shrinkage of the pancreas, dilation of the pancreatic duct with calcified stones inside, leading to impairment of both exocrine and endocrine functions; ② Onset in adolescence, with a male to female ratio of 3:1; ③ Characterized by chronic recurrent episodes of abdominal pain, diarrhea, indigestion, and nutritional deficiencies typical of chronic pancreatic disease; ④ Blood sugar levels can sometimes be very high, reaching 400-600 mg/dl (22-33 mmol/L); ⑤ Approximately 80% require insulin therapy; ⑥ However, even after discontinuation of medication, ketoacidosis is rare; ⑦ Most patients die between the ages of 40-50, and may also present with various chronic diabetic complications; ⑧ The cause of the disease is currently unknown, with suspicions of chronic CN poisoning from excessive consumption of cassava. This disease is also known as Type Z, as it was first reported by Zuidema in 1955. A similar case was observed in our hospital, confirmed by pathological anatomy.
⑵Protein-deficient type: This type is also known as the J-type or M-type, first observed in Jamaica in 1955. Characteristics include: ① onset in adolescents aged 15-25; ② a history of long-term protein and energy malnutrition leading to extreme emaciation, with BMI often <19; ③ grade II elevated blood sugar requiring insulin treatment; ④ rare ketosis; ⑤ in Asia, the male to female ratio is 2-3:1, equal in Africa, and more common in females in the West Indies; ⑥ the cause of the disease is unknown, possibly due to long-term malnutrition leading to low β-cell count and function, but unlike IDDM, C-peptide release still occurs after glucose stimulation.
4. Secondary and others
⑴ Pancreatic origin: Due to insufficient insulin secretion caused by pancreatic resection, pancreatitis, pancreas cancer, hemochromatosis, etc.
⑵ Endocrine: ① Pituitary diabetes due to excessive growth hormone secretion, seen in acromegaly or gigantism; ② Steroid diabetes due to excessive cortisol secretion, seen in Cushing's disease or syndrome; ③ Diabetes caused by glucagonoma due to excessive glucagon secretion by pancreatic A (α) cell tumors; ④ Diabetes caused by somatostatinoma due to excessive somatostatin secretion by pancreatic D (δ) cell adenomas, etc.
⑶ Drug-induced and chemical-induced: Various drugs and chemicals can affect glucose metabolism. For example, diuretic antihypertensive drugs like thiazides, glucocorticoids, female oral contraceptives, painkillers and antipyretics (aspirin, indomethacin, etc.), and tricyclic antidepressants like amitriptyline and desipramine mostly only cause impaired glucose tolerance.
⑷ Insulin receptor abnormalities: Further divided into: ① receptor defects such as congenital lipodystrophy and acanthosis nigricans with female masculinization; ② insulin-resistant diabetes caused by receptor antibodies.
⑸ Hereditary syndromes with diabetes: There are several types: ① metabolic disorders such as type I glycogen storage disease, acute intermittent porphyria, hyperlipidemia, etc.; ② hereditary neuromuscular diseases such as diabetes with optic atrophy, diabetes insipidus, and deafness; ③ progeria syndrome; ④ glucose intolerance syndromes secondary to obesity such as Prader-Willi syndrome.
(二)Impaired glucose tolerance (IGT) This group, according to diagnostic criteria, has fasting blood glucose <140mg/dl (7.8mmol/L) and postprandial 2-hour blood glucose <200mg/dl (11.1mmol/L) but higher than normal, with oral glucose tolerance test (OGTT) curves also between diabetes and the upper limit of normal. The characteristics of this group are: elevated blood sugar but not reaching diabetes standards, candidates for diabetes, and can be divided into obesity type and non-obese type. About 2/3 of these subjects can develop diabetes if deficient, and dietary and exercise interventions can reduce the incidence, making them an important target for diabetes prevention.
(三)Gestational diabetes mellitus (GDM) This group is limited to women who develop IGT and DM during pregnancy, so known diabetics during pregnancy do not belong to this group. Most patients can return to normal OGTT after childbirth, with only less than 30% of patients developing true diabetes (according to WHO standards) within 5-10 years of follow-up. This group accounts for about 1-2% of all pregnant women.
Absolute insulin deficiency is mostly seen in Type I (IDDM), while relative deficiency is mostly seen in Type II (NIDDM) patients. Evidence of absolute deficiency includes the following: ① Fasting plasma insulin concentration is very low, generally <4µU/ml (normal range is 5~20µU/ml), and may even be undetectable; both blood and 24-hour urine C-peptide levels are very low, often undetectable; ② Plasma insulin and C-peptide levels remain low after stimulation with glucose or glucagon, showing a flat curve; ③ No response to sulfonylurea treatment; ④ Pathological sections show insulitis, with lymphocyte infiltration in the early stage; in the late stage [third stage], β-cells show hyaline degeneration and fibrosis, with the number of β-cells reduced to only 10% of the original. Relative insulin secretion deficiency is manifested by fasting plasma insulin levels and insulin release test concentrations after glucose stimulation being lower than those of non-diabetic individuals of corresponding weight. However, in obese Type II diabetics, the baseline plasma insulin concentration or peak after stimulation is higher than that of normal controls, but lower than that of non-diabetic individuals of corresponding weight, with a delayed peak. In normal individuals, the insulin peak after glucose stimulation occurs within 30~60 minutes after oral glucose intake, while in Type II patients, the peak is delayed by about 30~45 minutes. See Figure 1.
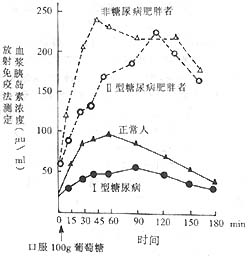
Figure 1 Comparison of plasma insulin concentrations in normal individuals, non-diabetic obese individuals, obese Type II diabetics, and Type I diabetics during an insulin release test
Note: ① Normal fasting plasma insulin concentration is 5~20µU/ml, which significantly increases after oral intake of 100g glucose, reaching a peak of over 250µU/ml at about 45 minutes, and does not return to normal within 3 hours.
② Obese individuals (non-diabetic) have a higher fasting plasma insulin concentration than normal individuals, with a peak occurring 90~120 minutes after oral intake of 100g glucose, but lower than normal.
③ Type I diabetics have a slightly lower fasting plasma insulin concentration than normal, with a peak occurring 90~120 minutes after oral intake of 100g glucose, but lower than normal.
④ Obese Type II diabetics have a fasting plasma insulin concentration higher than or equal to normal, with a peak occurring 2 hours after oral intake of 100g glucose, significantly higher than normal, but lower than obese non-diabetic individuals of corresponding weight.
⑤ The above data indicate that diabetics secrete less insulin than normal individuals of corresponding weight, with a delayed peak, suggesting relative insulin secretion deficiency, and Type I diabetics (juvenile, lean individuals) secrete even less.
Type I patients have the lowest daily insulin secretion, with both fasting baseline and peak after glucose stimulation significantly lower than normal, indicating absolute secretion deficiency. Normal-weight Type II patients have lower insulin secretion than normal individuals, with a lower and delayed peak after glucose stimulation, but obese diabetics have higher insulin secretion than normal individuals, with both fasting baseline and peak after glucose stimulation significantly higher than normal, but delayed, suggesting relative insulin secretion deficiency and a sluggish release response. The reasons for insulin secretion deficiency include the following factors:
(1) Genetic Factors Many patients have a positive family history, accounting for 8.7% of the 922 cases in our hospital, with foreign reports ranging from 25% to 50%. Genetic factors are quite certain for both Type I and Type II. According to recent twin studies, the concordance rate for Type I is 50%, with the rest attributed to environmental factors; for Type II, the concordance rate is as high as over 90%. From human chromosome studies, it is known that in Type I patients, the frequency of alleles on the short arm of the sixth chromosome, such as the HLA locus, increases, suggesting that the inheritance is a susceptibility tendency rather than the disease Bingben itself. This also varies with race and ethnicity. A large number of HLA studies conclude that the association between HLA D and DR antigens and Type I is the most significant, especially DW3-DR3 and DW4-DR4, which are prone to Type I diabetes. Finally, the DQβ chain variant was discovered, which has a closer relationship with Type I diabetes than DR4. DQβ57 non-aspartic acid and DQα52 arginine can significantly increase the susceptibility to Type I diabetes, but their impact is far less significant than in Caucasians. Type II patients, however, do not have special HLA markers.
(2) Autoimmunity - Closely related to type I patients. The autoimmune response of pancreatic islets may primarily be caused by a molecular mimicry process. If the chemical and conformational structure of an antigen closely resembles that of β cells, the antibodies produced against this antigen will also target β cells for immune attack. The antigen can be a virus or non-viral. As for the theory that severe destruction of β cells after viral infection leads to diabetes, due to inconsistent results in epidemiological and virological serological studies, as well as the fact that there is a long latent period between the detection of islet cell damage and the onset of symptoms, it suggests that this theory needs to be re-evaluated.
Individuals with a genetic predisposition to type I diabetes, if exposed to foreign antigens that closely resemble the composition of β cells (twin antigens), macrophages will bind tightly to them in conjunction with class II MHC, and with the cooperation of interleukins I and II, after recognition by helper T cells, a strong and persistent immune response against this antigen will be initiated, producing specific antibodies and immunologically active cells against this antigen. Since β cells closely resemble foreign antigens, they are also attacked by antibodies. After antibodies against foreign antigens bind to β cells, they attract macrophages, complement, and natural killer cells. Macrophages transmit information about self-antigens to helper T cells, which further amplify the immune response against self-antigens.
Evidence of cellular and humoral immunity in type I diabetes patients includes: ① Patients may be accompanied by various other immune sexually transmitted diseases, such as Graves' disease, Hashimoto's thyroiditis, pernicious anemia, primary chronic adrenal insufficiency, etc.; ② May be accompanied by organ-specific antibodies, including thyroid, gastric parietal cell, and anti-adrenal antibodies, etc.; ③ Those who have an acute onset and die within 6 months have islet inflammation; among them, there are infiltrations of T lymphocytes, NK cells, and K cells; ④ Positive leukocyte migration inhibition test; ⑤ Positive islet cell antibody (ICA) immunofluorescence assay, which can be as high as 85% within 1-2 years of onset in type I cases (normal positive rate is only 0.5%-1.7%), then gradually declines; later, islet cell surface antibodies (ICsA), complement-fixing islet cell antibodies (CF ICA), cytotoxic islet cell antibodies (Cytotoxic-ICA), 64K and 38K immunoprecipitating antibodies, etc., were discovered. Among them, ICsA, CF ICA, and immunoprecipitating antibodies selectively act on β cells. ⑥ Recently, antibodies against pancreatic islet cell antigens in type I patients have been identified as glutamic acid decarboxylase (GAD), with a positive rate of 69% in recently diagnosed type I patients, and still 59% in patients with a disease duration of 3-42 years, significantly higher than the ICA positive rate in type I patients with a disease duration of more than 3 years; ⑦ Decreased number and function of suppressor T lymphocytes, increased number and activity of K cells. The disease mechanism of type I patients is shown in Figure 2.
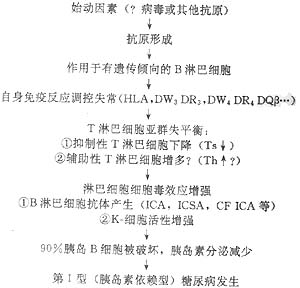
Figure 2 Disease mechanism of insulin-dependent diabetes mellitus.
(3) Insulin Antagonistic Hormones According to Unger et al., it is emphasized that in diabetes, the mechanism of disease leading to hyperglycemia is not only due to the relative and absolute deficiency of insulin but also must involve the relative or absolute excess of glucagon. In normal individuals, high blood sugar levels suppress glucagon, but in diabetics, this suppression does not occur, especially during ketoacidosis, and can only be restored after insulin treatment. In poorly controlled diabetes, glucagon levels are often elevated. Therefore, the presence of hyperglucagonemia is a fact and constitutes a component that contributes to hyperglycemia. This is the dualistic theory proposed by Unger et al., which suggests that in the mechanism of disease in diabetes, there is not only a relative and absolute deficiency of insulin but also a concomitant relative or absolute excess of glucagon, although the exact cause remains unclear.
Somatostatin (GHRIH, SS) secreted by pancreatic D (δ) cells inhibits both the secretion of insulin by pancreatic B (β) cells and the secretion of glucagon by A (α) cells, with a predominant inhibition of glucagon. Therefore, it can prevent diabetic ketoacidosis caused by insulin withdrawal in IDDM. According to Unger and Orci, it is speculated that under normal conditions, these three types of cells secrete three hormones that act in a paracrine manner to mutually regulate and maintain blood glucose within the normal range. When the function of B or D cells is impaired and secretion is insufficient, it can lead to excessive glucagon secretion, resulting in hyperglycemia and diabetes (the trihormonal hypothesis). However, Felig et al. believe that in the pathogenesis of diabetes, the relative or absolute deficiency of insulin remains the primary pathophysiological basis, and the role of glucagon may only exacerbate hyperglycemia or act as a secondary factor.
(4) Pathogenesis of Type II Diabetes The pathogenesis of Type II diabetes differs from Type I and is not caused by autoimmune destruction of β cells. It primarily involves insulin resistance and impaired insulin secretion based on genetic defects. Most scholars believe that insulin resistance is the primary abnormality, but it is likely that both factors coexist, with varying degrees of manifestation. It can be divided into three stages: the initial stage (first stage), characterized by insulin resistance and hyperinsulinemia, where plasma glucose remains normal; the intermediate stage (second stage), where insulin resistance worsens, and despite hyperinsulinemia, the higher the insulin levels, the less sensitive the receptors become, leading to postprandial hyperglycemia; and the late stage (third stage), where insulin resistance persists, but insulin secretion decreases, resulting in fasting hyperglycemia. The secretory function of pancreatic islets may further deteriorate due to the toxic effects of prolonged hyperglycemia. In Type II patients, amyloid deposits are found in the pancreas, consisting of a 37-amino acid polypeptide called amylin. Normally, amylin is stored together with insulin in secretory granules and is co-secreted with insulin under the stimulation of insulin secretagogues. In animal experiments, amylin has been shown to cause insulin resistance. The accumulation of amylin in islets may be related to the failure of insulin secretion in advanced stages of Type II diabetes.
Type II or NIDDM patients can exhibit insulin resistance at the following three levels.
1. Pre-receptor Level In 1979, Tager et al. discovered diabetes caused by mutant insulin, where the 25th amino acid (phenylalanine) on the B chain was replaced by leucine, rendering it ineffective. Later, it was found that the 24th amino acid (phenylalanine) on the B chain was also replaced by serine, and the 3rd amino acid (valine) on the A chain was replaced by leucine, both leading to diabetes. This suggests that mutations in the insulin gene during biosynthesis result in structurally abnormal and biologically less active insulin, causing diabetes. Similar cases involve the replacement of the 65th amino acid (arginine) in the connecting peptide by histidine, or defects in the connecting peptide enzyme that prevent the cleavage of proinsulin to remove the C-peptide, leading to excessive proinsulin and insufficient insulin in the bloodstream, resulting in diabetes. However, diabetes caused by such abnormal insulin accounts for only a very small proportion of disease causes.
2. Receptor Level The insulin receptor is a transmembrane macromolecular glycoprotein composed of two α subunits and two β subunits. It is encoded by the insulin receptor gene located on the short arm of chromosome 19, containing 22 exons and 21 introns.
After insulin specifically binds to the α subunit of the cell, a conformational change occurs, leading to the activation of tyrosine kinase embedded in the β subunit of the cell. This is the first step in the intracellular modification through which insulin exerts its effects. Mutations in the insulin receptor gene can affect receptor function in various ways: reduced rate of receptor biosynthesis; abnormal process of receptor insertion into the cell membrane; decreased affinity of the receptor for insulin; reduced tyrosine kinase activity; and accelerated receptor degradation. More than 30 point mutations or fragment deletions in the insulin receptor gene have been associated with severe insulin resistance. Clinically, several syndromes related to insulin receptor gene mutations have also been identified, such as leprechaunism and lipoatrophic diabetes.
3. Post-receptor level After insulin binds to the α subunit of its receptor, the tyrosine kinase of the β subunit is activated, leading to a series of intracellular changes that are not yet fully understood. Phosphorylation and dephosphorylation of substrates in the cytoplasm or organelles occur, depending on the characteristics of the target tissue and different key enzymes. Insulin promotes glucose transport and glycolysis in various tissues, glycogen synthesis in the liver and muscles, and inhibits gluconeogenesis and glycogenolysis. In this process, insulin relies on the activity of glucose transporter GLUT4 and many key enzymes such as glucose (G) kinase, glycogen synthase, phosphofructokinase, pyruvate kinase, and pyruvate dehydrogenase. Among these, the roles of GLUT4 and G kinase in insulin resistance have been extensively studied in recent years. The translocation of GLUT4 is dependent on insulin, which activates GLUT4 and promotes its translocation from intracellular microsomes to the cell membrane, thereby facilitating the entry of glucose into the cell. It has been found that the expression of the GLUT4 gene is reduced in adipocytes of patients with obesity and type II diabetes, leading to weakened insulin action and insulin resistance. G kinase is the first key enzyme in the glucose metabolism process, catalyzing the conversion of glucose to glucose-6-phosphate, and is specifically expressed in the liver and β cells. Many family studies have shown that in families with adult-onset diabetes of the young (MODY), the G kinase gene exhibits linkage disequilibrium, and certain gene mutations have been found to cause insulin resistance. The pathogenesis of type II diabetes and NIDDM is illustrated in Figure 3, primarily resulting from a combination of multiple factors on a genetic basis, with defects in insulin or post-receptor signaling, insulin resistance, and dysfunction of insulin secretion by pancreatic β cells being the main components.
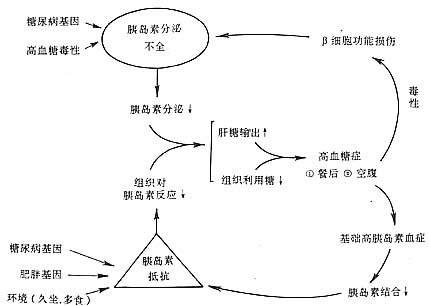
Figure 3 Pathogenesis of type II diabetes and NIDDM.
bubble_chart Pathological Changes
(1) Pancreatic Pathology: The pathological changes differ between Type I and Type II diabetes. In Type I, most cases present with insulitis. The number of islets and β-cells is significantly reduced, indicating an absolute insulin deficiency. In Type II, especially in obese individuals, the islets are larger than normal in the early stages, and β-cells are more numerous than normal; special staining shows a reduction in β-cell granules in sections. After more than 5 years of diabetes, the number, size of islets, and β-cells all decrease, until autopsy after death reveals several typical changes. According to Warren et al.'s analysis of pancreatic pathology results from 811 diabetic patients of various ages, the findings are as follows: normal 33%, hyaline degeneration 41%, fibrosis 23%, edema degeneration 4%, and lymphocyte infiltration 1%.
In cases of islet hyaline degeneration, histochemistry shows hyaline material stained eosinophilic, distributed within β-cells, as a type of glycoprotein. Under electron microscopy, its ultrastructure is identical to amyloid deposits, hence termed islet amyloidosis, possibly amylin. This lesion is more common in Type II patients over 40 years old and those with the disease for more than 10 years.
Fibrosis can occur in both Type I and Type II diabetes, especially in the elderly. In juvenile patients, it suggests the aftermath of isletitis, eventually leading to complete islet fibrosis, with β-cells often <10%. In Type II cases, islet fibrosis is often accompanied by pancreatic acinar fibrosis and intra-pancreatic vascular sclerosis.
(2) Vascular Pathology: Currently, the most severe pathology threatening the lives of diabetic patients is cardiovascular disease, with over 70% of patients dying from various complications of cardiovascular disease; vascular lesions are very extensive, affecting large, medium, and small vessels, arteries, capillaries, and veins, often complicating many organ pathologies, especially microvascular lesions in the cardiovascular system, kidneys, retina, nerves, muscles, skin, etc.
1. Arteries: Atherosclerosis is seen in more than half of the patients, with onset not limited by age, mainly involving the aorta, coronary arteries, cerebral arteries, etc., often causing severe complications in the heart, brain, and kidneys leading to death. Peripheral artery sclerosis, especially in the dorsalis pedis arteries of the lower limbs, can cause gangrene.
2. Microvessels: Including capillaries, arterioles, and venules, light and electron microscopy reveal that the characteristic of microvascular lesions in diabetes is thickening of the capillary basement membrane: normal basement membrane thickness is about 80-250nm, which can increase to 500-800nm in diabetic patients. There is carbohydrate deposition in the basement membrane, mainly with a corresponding proportional decrease in hydroxylysine, suggesting lysine is hydroxylated to form hydroxylysine. This microvascular lesion is often accompanied by microcirculation abnormalities, serving as the pathological basis for complications in many organs. It is very widely distributed, especially in the glomeruli, retina, nerves, myocardium, muscles, etc., causing renal lesions, retinal lesions, neuropathy, and myocardial and muscle lesions, becoming the main factor determining patient prognosis.
There are two theories on the pathogenesis of basement membrane thickening:
⑴ Metabolic Disorder Theory: Recent studies on generation and transformation have shown that the thickening of this membrane is due to the deposition of glycoproteins, most notably in the glomerular basement membrane, and also seen in the glomerular mesangial membrane. The endothelial cells, epithelial cells, and mesangial cells of the glomerulus can all synthesize the substances in this basement membrane. In diabetic patients with microalbuminuria, there is proliferation of glomerular mesangial cells and the myomedial cells of the stirred pulse, both of which can synthesize extracellular matrix (ECM) components such as collagen IV, linking proteins, and heparan sulfate proteoglycans (HS-PG). Not only is there an abnormal increase in quantity compared to patients without microalbuminuria, but there are also qualitative changes: in glomerulosclerosis, the content of negatively charged HS-PG in the glomerular basement membrane (GBM) is significantly reduced, and similar changes are observed in the coronary stirred pulse. The reduction of HS-PG in the ECM or GBM leads to a decrease in the negative charge of the GBM, making albumin more likely to leak out through the GBM fistula disease, and the stirred pulse is also more prone to sclerosis. Therefore, microalbuminuria is not only a risk factor for diabetic nephropathy but also for cardiovascular disease. The thickening of the capillary basement membrane is closely related to hyperglycemia and increased growth hormone, which promote enhanced synthesis and slowed degradation of glycated proteins.
(2) Genetic theory: Thickening of the capillary basement membrane can be observed in the prediabetic stage, but metabolic disorders are not yet obvious at this time, so it is believed to be caused by genetic factors.
The main functions of the basement membrane or ECM are to maintain structural integrity and exert anti-proliferative effects. When the basement membrane thickens, the degree of cross-linking changes, and the negative charge decreases, leading to increased permeability. Small molecular proteins leak out, forming microalbuminuria, which can progress to proteinuria and advanced stage kidney disease. Additionally, retinal membrane lesions and arteriosclerosis can occur.
(3) Kidneys: Diabetic glomerulosclerosis accounts for 25-44% of cases and can be classified into nodular, diffuse, and exudative types. It is particularly common in type I diabetes. Additionally, pyelonephritis and arteriolosclerosis are also common, while necrotizing renal papillitis is rare. Acute renal failure accompanied by tubular necrosis can occur in those who die from diabetic coma.
(4) Liver: The liver is often enlarged, with fatty infiltration, edema degeneration, and reduced glycogen. Fatty liver is common.
(5) Heart: In addition to widespread coronary arteriosclerosis and myocardial infarction, myocardial lesions have also been confirmed, supported by autopsy findings and various animal models (including BB rat diabetes). Myocardial cells show a significant reduction in myofilaments, and electron microscopy reveals a loss of myofibrillar proteins. In severe cases, focal necrosis of myocardial fibers occurs. Lipid droplets and glycogen granules deposit within myocardial cells. Mitochondria swell, cristae break, and the matrix becomes vacuolated. The myocardial cell membrane ruptures, and myelin bodies and lipofuscin granules form. The intercalated disc adhesive membrane shows increased intercellular gaps. In BB rats, microvascular lesions appear after 16 weeks of diabetes, with thickening of the basement membrane, endothelial cell proliferation, and thickening of the vessel walls, accompanied by PAS-positive glycoprotein hyaline deposits. Perivascular myocardial interstitial fibrosis occurs.
(6) Nervous system: The entire nervous system can be affected. Peripheral neuropathy is the most common, presenting with edema, degeneration, and shedding of the myelin sheath; axonal degeneration, fibrosis, and swelling of motor endplates. Autonomic nerves show chromatolysis, cytoplasmic vacuolation, and nuclear necrosis, with reduced or absent cholinesterase activity. Tissue sections reveal beaded or spindle-shaped breaks and vacuolar degeneration in autonomic nerves. The spinal cord and its nerve roots show atrophy and rubbery changes, thinning of the myelin sheath, thinning of axons, grade III glial fibrosis with vacuolar degeneration, and replacement of anterior horn cells with adipose tissue. Brain edema is common in those who die from diabetic coma, and ganglion cells often show edema degeneration.
bubble_chart Clinical Manifestations
Diabetes is a chronic progressive disease. Except for Type I, which can have a relatively acute onset, Type II generally has a slow onset, making it difficult to estimate the timing. In the early stages, mild cases often show no symptoms, but severe cases and those with complications have obvious and typical symptoms. The course of the disease is long, and the asymptomatic period is difficult to estimate. From the appearance of symptoms or clinical diagnosis, it often takes several years to several decades. Sometimes, there may be no symptoms at all until severe complications such as cerebrovascular or heart complications occur, and diabetes is only discovered shortly before death. The clinical manifestations of each stage are described below.
(1) Asymptomatic period: Most patients are middle-aged or older with Type II diabetes, with good appetite, obesity, and normal mental and physical condition. They are often accidentally discovered to have a small amount of glycosuria after meals during physical examinations or examinations for other diseases or pregnancy. When fasting urine sugar is measured, it is often negative, fasting blood sugar is normal or slightly high, but the postprandial blood sugar peak exceeds normal, and the glucose tolerance test often shows diabetes. Many patients may first discover common comorbidities or complications such as hypertension, arteriosclerosis, obesity, cardiovascular disease, hyperlipidemia, or hyperlipoproteinemia, or recurrent suppurative skin infections and urinary tract infections. Type I patients are sometimes discovered due to growth retardation, physical weakness, weight loss, or ketosis.
In the asymptomatic period of Type II diabetes or only in the state of IGT, patients often already have hyperinsulinemia, while in Type I diabetes, ICA and GAD are often elevated before symptoms appear.
Before the asymptomatic period, there is actually a stage where general tests, including the glucose tolerance test, are negative, but these subjects may have a family history of diabetes, a history of macrosomia, or associated metabolic syndromes such as insulin resistance, hyperinsulinemia, hypertension, high LDL, and obesity, thus belonging to the high-risk group for diabetes, now referred to by WHO as latent glucose tolerance abnormalities.
Asymptomatic diabetes can be more easily controlled through diet and/or exercise, preventing and reducing chronic complications.
(2) Symptomatic period: Patients in this period often have symptoms of varying severity, often accompanied by certain complications or accompanying symptoms or comorbidities. Sometimes the symptoms of the disease are very mild, but the symptoms of comorbidities or complications are very severe, and sometimes they may appear before the symptoms of diabetes, or appear as the main symptom, masking the symptoms of diabetes. Bingben For example, elderly patients often first have coronary heart disease symptoms (angina, myocardial infarction, arrhythmia, heart failure, etc.), or cerebrovascular accident symptoms, but the diabetes symptoms are very mild, so they are often overlooked or misdiagnosed in clinical practice. Middle-aged patients may first have urinary tract infections, subcutaneous nodules, skin abscesses, or certain surgical conditions such as cholecystitis, pancreatitis, etc. Juvenile patients may sometimes have ketoacidosis as the first symptom. If fasting and postprandial blood sugar are significantly elevated, the following typical symptoms generally occur.
1. Polyuria, polydipsia, and polyphagia: Due to glycosuria, the osmotic pressure of urine increases, and the reabsorption of water by the renal tubules decreases, leading to increased urine output. Patients have frequent urination, sometimes more than twenty times a day and night, with multiple nighttime awakenings affecting sleep. Not only is each urination large and frequent, but the total daily urine output is often more than 2-3L, and can sometimes reach more than ten liters. Due to polyuria and water loss, patients suffer from thirst, and the amount and frequency of drinking increase, proportional to blood sugar concentration, urine output, and sugar loss; when insulin is lacking and ketoacidosis occurs, sodium and potassium ion reabsorption becomes more difficult, worsening polyuria; often leading to plasma concentration, affecting osmotic pressure, and causing serious consequences such as hyperosmolar unconsciousness.
2. Polyphagia: Due to sugar loss, sugar is not fully utilized, accompanied by high blood sugar stimulating insulin secretion, appetite is often hyperactive, and hunger is easily felt. The staple food sometimes reaches 1-2 pounds, and dishes are more than double the normal amount, yet still not satisfying. However, if appetite suddenly decreases in seasonal disease, attention should be paid to whether there are infections, fever, acidosis, or complications such as induced ketosis. Polyuria, polydipsia, and polyphagia are clinically often referred to as the "three polys."
3. Fatigue, weight loss, weakness Due to metabolic disorders, reduced energy utilization, negative nitrogen balance, dehydration and electrolyte imbalance, and worsened by ketosis, patients feel fatigued, weak, and powerless. Especially in juvenile (Type I) and severe (Type II) patients, emaciation is evident, with weight loss potentially reaching tens of pounds, and labor capacity often weakened. Long-term illness in children inhibits growth and development, resulting in short stature, a shallow yellow complexion, lackluster hair, and generally weak physical condition. However, middle-aged and older patients with mild Type II often become obese due to overeating.
4. Cutaneous pruritus is commonly seen in the vulvar region, caused by the local irritation of urinary sugar. Sometimes it is complicated by fungal vaginitis such as Candida albicans, making the cutaneous pruritus more severe, often accompanied by secretions like leucorrhea. Dehydration leading to dry skin can also cause generalized cutaneous pruritus, but this is less common.
5. Other symptoms include soreness and numbness in the limbs, lumbago, decreased libido, impotence and infertility, menstrual disorders, constipation, and visual disturbances. Sometimes there is intractable diarrhea, with bowel movements ranging from 2-3 to 5-6 times a day, presenting as loose paste, generally non-inflammatory and functional diarrhea, possibly related to autonomic nervous system dysfunction. Occasionally, there may be orthostatic hypotension, profuse sweating, and severe urinary incontinence, which are also serious neurological manifestations. Many symptoms are due to complications and comorbidities.
Signs: In early mild cases, there are often no signs. In long-standing cases, various signs may be observed due to dehydration, nutritional disorders, secondary infections, and complications involving the cardiovascular, nervous, renal, ocular, muscular, and joint systems. The liver may be enlarged, especially in type I patients, and can return to normal with appropriate treatment. Cases of cutaneous xanthoma and carotenemia are rare in domestic cases.
bubble_chart Auxiliary Examination
(1) Urine
1. Glycosuria: In severe cases, glycosuria is often present before treatment, but in early mild cases, it only appears after meals or under stress conditions such as infection. Many long-term patients have elevated renal glucose thresholds, resulting in high blood sugar without glycosuria. Urine sugar can range from trace amounts to over 10g%, generally around 0.5% to 5g%, and occasionally can exceed 15g%. Daily sugar loss can range from trace amounts to several hundred grams. Generally, under a fixed diet, the amount of sugar loss is directly proportional to the severity of the condition and is also related to the level of blood sugar. There are three factors determining the presence and amount of glycosuria: ① blood sugar concentration, ② glomerular filtration rate, ③ renal tubular reabsorption rate of glucose. The normal renal glucose threshold is 160-180mg/dl; if the inulin clearance rate is 125ml/min, the renal tubules can reabsorb 250-300mg/min of glucose from the glomerular filtrate, so there is no sugar in the urine when blood sugar is normal. However, many advanced stage patients due to renal tubular sclerosis, glomerulosclerosis, and other lesions, renal blood flow decreases, glomerular filtration rate decreases while the renal tubular reabsorption function remains relatively good, then even with high blood sugar concentration, there is no glycosuria, clinically known as increased renal glucose threshold. Conversely, if the renal tubular reabsorption function drops below 120mg/min, then even with a blood sugar concentration around 100mg/dl, glycosuria can still occur, clinically known as decreased renal glucose threshold, seen in renal glycosuria, which is one of the important differential diagnoses of this disease.
2. Proteinuria: Generally, patients without complications have negative or occasional albuminuria, less than 29mg/d or 20µg/min, albumin excretion rate between 30mg-300mg/d, referred to as microalbuminuria, indicating the patient already has early diabetic nephropathy, when albumin excretion rate >300mg/d, it is called clinical or macroalbuminuria, routine urine tests can show proteinuria, this seasonal disease change is no longer early, with the development of the disease, the amount of urine protein increases, can reach 0.5g% (approximately equivalent to 4+), daily protein loss exceeds 3g (normal <30mg/d), often causing severe hypoproteinemia and nephrotic syndrome. Hypertension, renal tubular sclerosis, heart failure patients also often have a small amount of proteinuria, sometimes in ketoacidosis, hyperosmolar unconsciousness with circulatory failure or shock dehydration severely affecting renal circulation, proteinuria can also appear.
3. Ketonuria: Seen in severe cases or dietary disorders accompanied by ketoacidosis, can also be due to infection, high fever, etc., eating very little (starvation ketosis).
4. Casts: Often found simultaneously with large amounts of proteinuria, mostly seen in diffuse glomerulosclerosis, mostly hyaline casts and granular casts.
5. Microscopic hematuria and others: Occasionally seen in cases accompanied by hypertension, glomerulosclerosis, renal tubular sclerosis, pyelonephritis, renal papillary necrosis, or heart failure, etc. A large number of white blood cells often suggest urinary tract infection or pyelonephritis, more common than in non-diabetic patients. In cases of renal papillary necrosis, necrotic renal papillary tissue can sometimes be excreted, providing strong evidence for the diagnosis of the disease.
(2) Blood: Most patients without complications have normal blood routine, but there are the following generation and transformation changes:
1. Blood sugar: In type II diabetes, grade I cases fasting blood sugar can be normal, postprandial often exceeds 200mg/dl (11.1mmol/L), severe and type I cases are significantly increased, often in the range of 200-400mg/dl (11.1-22.0mmol/L), sometimes can be as high as 600mg/dl (33.0mmol/L) or more. One case in our hospital reached 1200mg/dl (66.0mmol/L); but such patients often accompany hyperosmolar unconsciousness and diabetic ketoacidosis with severe dehydration, which can rapidly decrease after treatment.
2. Blood Lipids - Individuals with poorly controlled or untreated conditions often present with hyperlipidemia and hyperlipoproteinemia. This is particularly common in Type II obese individuals, but can also occur in lean patients. The plasma may appear as a milky, turbid liquid with elevated levels of fat components, especially triglycerides, cholesterol, and free fatty acids. Sometimes, a milky cream layer forms on top, with chylomicrons at the very top. Most cases are classified as Type V hyperlipoproteinemia. Triglycerides can increase 4 to 6 times above normal levels, free fatty acids can increase more than 2 times, and total cholesterol, phospholipids, and low-density lipoprotein (LDL) are significantly elevated. This is especially pronounced in diabetics with atherosclerotic cardiovascular disease and renal complications, where lipid levels rise more markedly compared to those with simple diabetes. An increase in free fatty acids further indicates accelerated fat breakdown, reflecting poorer diabetes control and a close relationship with elevated blood glucose levels, making it a more sensitive indicator than triglyceride elevation. High-density lipoprotein (HDL2Ch), especially subtype 2, is reduced, and Apo.A1, A2 are also decreased.
3. Changes in blood ketones, electrolytes, pH, CO2 binding capacity, and non-protein nitrogen (urea nitrogen) will be described in sections related to ketoacidosis, hyperosmolar unconsciousness, lactic acidosis, and renal disorders.
Typical cases present with the triad of symptoms suggesting the disease. For mild cases without symptoms, diagnosis relies entirely on laboratory tests, often discovered during health check-ups or incidentally due to other diseases. Many patients first discover complications, then trace back to this disease. However, regardless of the presence of symptoms or complications, the key is to first consider the possibility of this disease and conduct urine and blood glucose tests for a definitive diagnosis.
(1) Glycosuria When interpreting urine glucose test results, the following situations should be noted. Urine glucose test results are only for diagnostic reference, and the diagnosis of diabetes mellitus requires blood glucose testing.
1. If there is a small or trace amount of glycosuria, and it occasionally appears after meals, blood glucose and glucose tolerance tests should be conducted. It should be noted that in Benedict's solution, copper sulfate is reduced by sugars to cuprous oxide, causing a reaction. Many drugs, such as morphine, salicylates, chloral hydrate, aminopyrine, p-aminobenzoic acid, large amounts of citric acid, uric acid, and many other sugars, can also reduce copper sulfate, leading to false-positive results. Therefore, urine glucose test strips made with glucose oxidase are now widely used to avoid false-positive results.
2. If there are clinical signs or suspicion of diabetes but repeated negative urine glucose results, fasting and 2-hour postprandial blood glucose should be measured to rule out elevated renal glucose threshold.
(2) Blood Glucose There are three common methods for measuring blood glucose: venous plasma glucose (VPG), capillary whole blood glucose (CBG), and venous whole blood glucose (VBG). The first two are most commonly used. Results from different methods vary slightly. VPG results are about 10% higher than CBG and about 15% higher than VBG. When analyzing blood glucose reports, other conditions that cause increased glucose concentration should be excluded, such as after glucose injection, various endocrine disorders, brain lesions, and stress conditions, which will be discussed later. In mild or early cases, especially type II, fasting blood glucose may be normal and should not be easily ruled out; a 2-hour postprandial blood glucose or glucose tolerance test must be performed.
(3) Glucose Tolerance Test For patients with normal or slightly elevated fasting blood glucose and occasional glycosuria, or those suspected of having diabetes (such as those with a positive family history, or repeated late abortion, premature labor, dead fetus, macrosomia, difficult delivery, late abortion in multiparous women, or those with frequent boils and abscesses), a glucose tolerance test should be performed. However, for severe cases with significantly elevated fasting blood glucose, the diagnosis is already clear, and a large amount of glucose can increase the burden, so the test should be avoided.
1. Oral Glucose Tolerance Test (OGTT) This is the most commonly used method. Previously, adults were given 100g at once, but in recent years, WHO recommends 75g (or 1.75g per kg of standard body weight, not exceeding 75g, regardless of age). Venous blood is drawn before and 1/2, 1, 2, and 3 hours after oral glucose administration, and urine samples are collected for glucose testing.
Results: Normal individuals (aged 15-50) have fasting blood glucose of 70-100mg/dl (true glucose method such as glucose oxidase), with peak glucose absorption occurring within 30-60 minutes (delayed in those over 50), generally not exceeding 170mg/dl. Blood glucose concentration returns to normal within 2 hours and may drop below normal by 3 hours. Urine glucose is negative. The difference between the 100g and 75g methods is minimal, with the latter showing earlier normalization of blood glucose. Those over 50 often have physiologically reduced glucose tolerance, with a 10mg/dl increase in blood glucose for every 10 years of age at the 1-hour peak.
Diagnostic Criteria: The provisional standard proposed by WHO in 1985 is widely used as follows:
(1) With diabetes symptoms, venous plasma glucose ≥200mg/dl (11.1mmol/L) at any time and fasting venous plasma glucose ≥140mg/dl (7.8mmol/L) can confirm diabetes.
(2) If the result is suspicious, an OGTT should be performed (75g of oral glucose for adults, 1.75g per kg of body weight for children, with a total not exceeding 75g). A 2-hour blood glucose level ≥200mg/dl (11.1mmol/L) can be diagnosed as diabetes. A blood glucose level >140mg/dl to <200mg/dl indicates impaired glucose tolerance (IGT).
(3) If there are no symptoms of diabetes, in addition to the above two diagnostic criteria, another indicator is needed to assist in diagnosis, which is a 1° or 2° blood glucose level ≥200 mg/dl on the OGTT curve or another fasting blood glucose level ≥140 mg/dl.
(4) The diagnostic criteria can also be applied to gestational diabetes.
The above diagnostic criteria can be summarized in Table 1.
Table 1: Provisional Diagnostic Criteria for Diabetes by the World Health Organization (WHO)
| Oral Glucose Tolerance Test (OGTT) | Blood Glucose mg/dl (mmol/L) | ||
| Venous Whole Blood | Venous Plasma | Capillary Whole Blood | |
| Diabetes Mellitus (DM) | |||
| Fasting and/or 2 hours post glucose load | ≥120 (6.7) ≥180 (10.0) | ≥140 (7.8) ≥200 (11.1) | ≥120 (6.7) ≥200 (11.1) |
| Impaired Glucose Tolerance (IGT) | |||
| Fasting and 2 hours post glucose load | <120 (6.7) ≥120 (6.7) ~ <180 (10.0) | <120 (7.8) ≥140 (7.8) ~ <200 (11.1)) | <120 (6.7) ≥140 (7.8) ~ <200 (11.1) |
When diagnosing diabetes, it is necessary to exclude various factors that affect glucose tolerance, including endocrine disorders such as anterior pituitary, adrenal cortex, and hyperthyroidism, obesity, liver disease, various drugs (such as thiazide diuretics, female contraceptives, glucocorticoids, phenytoin, diazoxide, etc.), stress conditions (such as fever, infection, acute myocardial infarction, surgical treatment, etc.), and potassium loss.
2. Postprandial 2-hour blood glucose measurement: Measure blood glucose 2 hours after consuming carbohydrate foods equivalent to 100g of glucose, such as 2 liang of steamed bread or rice. If the blood glucose level exceeds 140 mg/dl, it indicates impaired glucose tolerance; if it is ≥200 mg/dl, it indicates diabetes.
Since a low-carbohydrate diet or fasting state can reduce glucose tolerance, it is important to adjust the diet 3 days before the test to ensure carbohydrate intake is not less than 250g/day to obtain reliable results.
For some patients, to estimate β-cell function or blood glucose control status, the following measurements can also be performed:
1. Fasting Plasma Insulin Measurement Our hospital uses the radioimmunoassay method to determine the normal range of fasting plasma insulin as 5~20 µu/ml. Type I patients often have levels below 5 µu/ml, sometimes too low to be detected. Type II patients generally have normal plasma insulin concentrations, though a few may have lower levels. Obesity patients often have levels higher than normal, and those with significantly elevated levels exhibit hyperinsulinemia, indicating insulin resistance. The latter is a component of metabolic syndrome and can be considered one of the risk factors for coronary heart disease, which has garnered much attention in recent years. Insulin and proinsulin have immunological cross-reactivity, so both can be detected by general radioimmunoassay methods. However, the adverse effects on cardiovascular health may be more pronounced with proinsulin than with insulin. Research on the clinical application of proinsulin measurement is already underway.
2. Insulin Release Test: During an oral glucose tolerance test, plasma insulin concentration can be simultaneously measured to reflect the reserve function of pancreatic β-cells. In Type I patients, besides very low fasting levels, insulin levels remain low after glucose stimulation, showing a low flat curve, especially when calculating the simultaneous glucose (G) to insulin (IRI) ratio, (IRI)/G, indicating low insulin secretion (normal value is 25 µu/mg). In Type II patients, fasting levels may be normal or high, showing delayed release after stimulation. If insulin levels do not significantly rise or remain low after glucose stimulation, it suggests low β-cell function.
3. C-peptide Measurement: Insulin released from pancreatic β-cells is deactivated by insulinase after passing through the liver and kidneys, with 80% destroyed in each circulation in peripheral blood, and its half-life is only 4.8 minutes, so blood concentration can only represent a very small part of its total secretion. C-peptide and insulin are equimolar peptides split from proinsulin, not deactivated by liver enzymes, only excreted by the kidneys, and its half-life is 10-11 minutes, so blood concentration can better reflect the reserve function of pancreatic β-cells. C-peptide measurement is not interfered by insulin antibodies, has no cross-immunoreaction with insulin measurement, and is not affected by exogenous insulin injection, so in recent years, C-peptide blood concentration or 24-hour urinary excretion has been used to reflect β-cell secretion function.
⑴ Serum C-peptide Concentration Measurement: Using radioimmunoassay, the fasting serum C-peptide in normal people is 1.0±0.23 mg/dl, peaking at 60 minutes after oral glucose, with a concentration of 3.1 ng/ml. According to Block et al., normal people's serum C-peptide rises from 1.3±0.3 ng/ml to 4.4±0.8 ng/ml 60 minutes after oral 100g glucose, while Type II diabetics only rise to 2.3 ng/ml after 2 hours. Another 5 Type I patients treated with insulin for more than 5 years had very low C-peptide levels, undetectable both fasting and after stimulation.
⑵ 24-hour Urine C-peptide Measurement: Normal people's 24-hour urine C-peptide is 36±4 µg, Type I patients only 1.1±0.5 µg, Type II patients 24±7 µg, daily C-peptide excretion is about 5% of insulin secretion, while insulin excretion only accounts for 0.1%.
The above C-peptide measurement can identify β-cell function in Type I patients during insulin treatment, now not only used in research but also commonly used in clinical practice.
4. HbA1c Measurement: For those with normal fasting blood glucose but large fluctuations, it can reflect blood glucose status in the past 2-3 months, normal value HbA1c 6%, HbA1 8%, diabetics are often higher than normal.
5. Fructosamine Measurement: Normal serum fructosamine is 2.13±0.24 mmol/L (0.3 mmol/L lower in plasma), reflecting blood glucose status in the past 1-4 weeks, parallel to HbA1c, diabetics of both Type I and II are elevated, especially Type I.
In summary, diabetes diagnosis can be based on medical history, clinical manifestations, supplemented by the above urine glucose, blood glucose, and OGTT. In addition, it is necessary to check for various complications and accompanying conditions, and estimate the severity, type, development stage, and functional status of major organs, which is very important for the treatment and prognosis of the disease.
bubble_chart Treatment Measures
In recent years, although many disease causes such as genetic issues, viral infections, autoimmunity, and hormones antagonistic to insulin have been studied, there is still a lack of effective disease cause treatments. Cyclosporin A is only effective for a few early type I cases, and islet and pancreas transplants have only shown initial success. Artificial pancreases (insulin pumps), while better at controlling metabolism, still lack reliable data for long-term prevention and treatment of chronic complications. Therefore, the clinical treatment goals for patients focus on strictly controlling metabolic disorders, especially hyperglycemia, correcting obesity and hypertension, promoting the recovery of β-cell function, ensuring normal growth and development and pregnancy processes, preventing complications, and improving quality of life.
Since the results of the Diabetes Control and Complications Trial (DCCT) were published in 1993, it has been widely accepted by diabetes healthcare professionals worldwide that strict control of hyperglycemia can significantly reduce various chronic complications by 50-70%.
Specific prevention and treatment measures are as follows:
(1) Education and Awareness: Since more than half of early-stage patients have no symptoms or only mild symptoms, they often cannot be diagnosed and treated in time. Therefore, it is crucial to vigorously promote diabetes education, allowing diagnosed patients to understand diabetes and gradually become familiar with the comprehensive treatment principles of diet, exercise, medication, and monitoring of urine and blood sugar, cooperating with healthcare professionals to improve control quality; for individuals over 50 years old, especially those at high risk, an annual postprandial 2-hour blood sugar screening should be conducted to ensure that asymptomatic patients are diagnosed and treated as early as possible.
The educational content should also include the importance of long-term adherence to dietary therapy, methods for testing urine and blood sugar, and for those on insulin therapy, they should also learn sterile injection techniques, recognize hypoglycemia reactions, and know initial treatment steps.
Educational activities can include classes, seminars, watching slides, videos, scientific films, or even individual counseling.
(2) Dietary Therapy: Proper dietary control can reduce the burden on β-cells. For older, overweight patients with no or few symptoms, especially those with normal fasting and postprandial plasma insulin levels, dietary control is often the main treatment. For severe or juvenile (type I) or brittle diabetes patients, in addition to medication, strict dietary control is essential. The diet must contain sufficient nutrients and appropriate proportions of carbohydrates, proteins, and fats. Based on the patient's specific needs and lifestyle habits, the following estimates are made:
1. Determine the standard weight from Table 2 based on the patient's age, gender, and height.
Table 2 Ideal Weight for Men (kg)
| Age (years) | Height (cm) | ||||||||||
| 140 | 144 | 148 | 152 | 156 | 160 | 164 | 168 | 172 | 176 | 180 | |
| 15 | 41 | 42 | 43 | 44 | 45 | 47 | 48 | 50 | 53 | 55 | 58 |
| 17 | 44 | 44 | 45 | 47 | 48 | 49 | 51 | 53 | 55 | 58 | 61 |
| 19 | 45 | 46 | 47 | 49 | 50 | 51 | 53 | 55 | 57 | 60 | 67 |
| 21 | 47 | 48 | 49 | 50 | 51 | 53 | 54 | 56 | 59 | 61 | 64 |
| 23 | 48 | 49 | 50 | 51 | 52 | 54 | 55 | 57 | 59 | 62 | 65 |
| 25 | 48 | 49 | 50 | 51 | 52 | 54 | 56 | 58 | 60 | 62 | 66 |
| 27 | 48 | 49 | 50 | 51 | 53 | 54 | 56 | 58 | 60 | 63 | 66 |
| 29 | 49 | 50 | 51 | 52 | 53 | 55 | 56 | 58 | 60 | 63 | 66 |
| 31 | 49 | 50 | 51 | 52 | 54 | 55 | 57 | 59 | 61 | 64 | 67 |
| 33 | 50 | 51 | 52 | 53 | 54 | 56 | 57 | 59 | 62 | 64 | 67 |
| 35 | 50 | 51 | 52 | 53 | 55 | 56 | 58 | 60 | 62 | 65 | 68 |
| 37 | 51 | 52 | 53 | 54 | 55 | 57 | 58 | 60 | 62 | 65 | 68 |
| 39 | 51 | 52 | 53 | 54 | 55 | 57 | 59 | 60 | 63 | 65 | 69 |
| 41 | 51 | 52 | 53 | 54 | 56 | 57 | 59 | 61 | 63 | 66 | 69 |
| 43 | 51 | 52 | 53 | 55 | 56 | 57 | 59 | 61 | 63 | 66 | 69 |
| 45 | 52 | 53 | 54 | 55 | 56 | 58 | 59 | 61 | 63 | 66 | 69 |
| 47 | 52 | 53 | 54 | 55 | 56 | 58 | 60 | 62 | 64 | 66 | 70 |
| 49 | 52 | 53 | 54 | 55 | 57 | 58 | 60 | 62 | 64 | 67 | 70 |
| 51 | 52 | 53 | 54 | 56 | 57 | 58 | 60 | 62 | 64 | 67 | 70 |
| 53 | 52 | 53 | 54 | 56 | 57 | 58 | 60 | 62 | 64 | 67 | 70 |
| 55 | 52 | 53 |
expand_less
cookieThis website uses cookie technology to provide high-quality and secure browsing services. Turning off cookies may result in inability to browse normally. If you continue to browse this site, you agree to this site's use of cookie technology and fully accept this site. Terms of Service.
| ||||||||